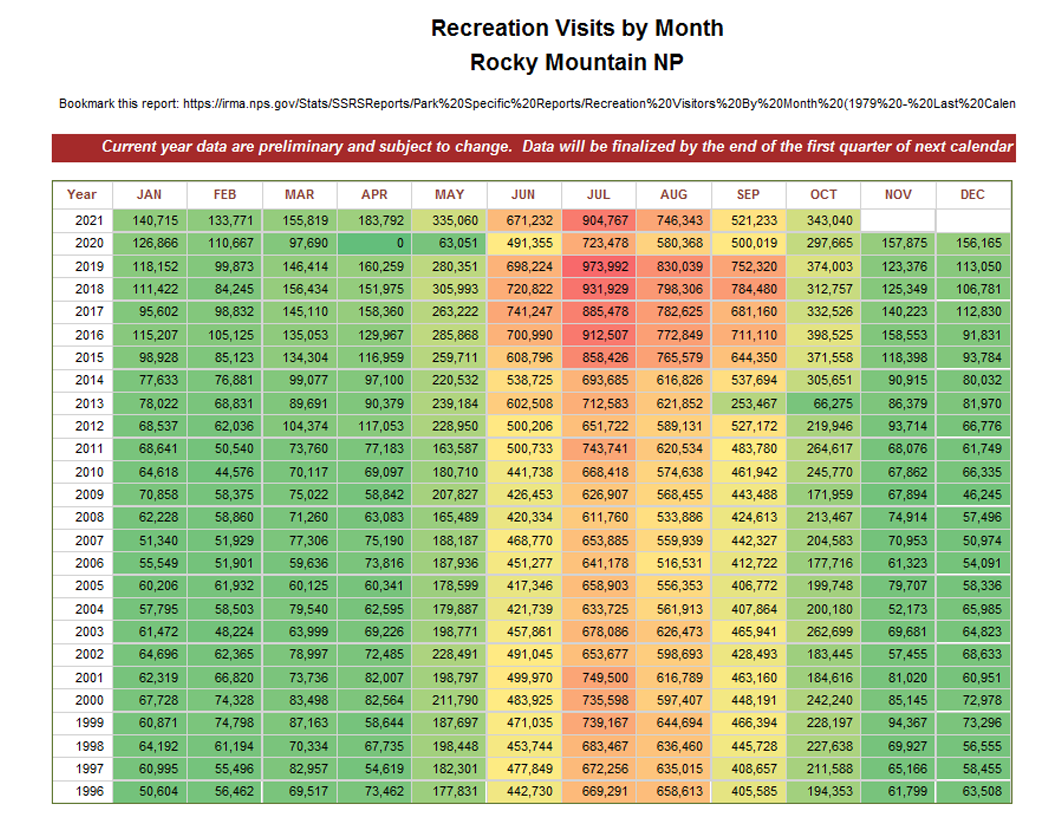
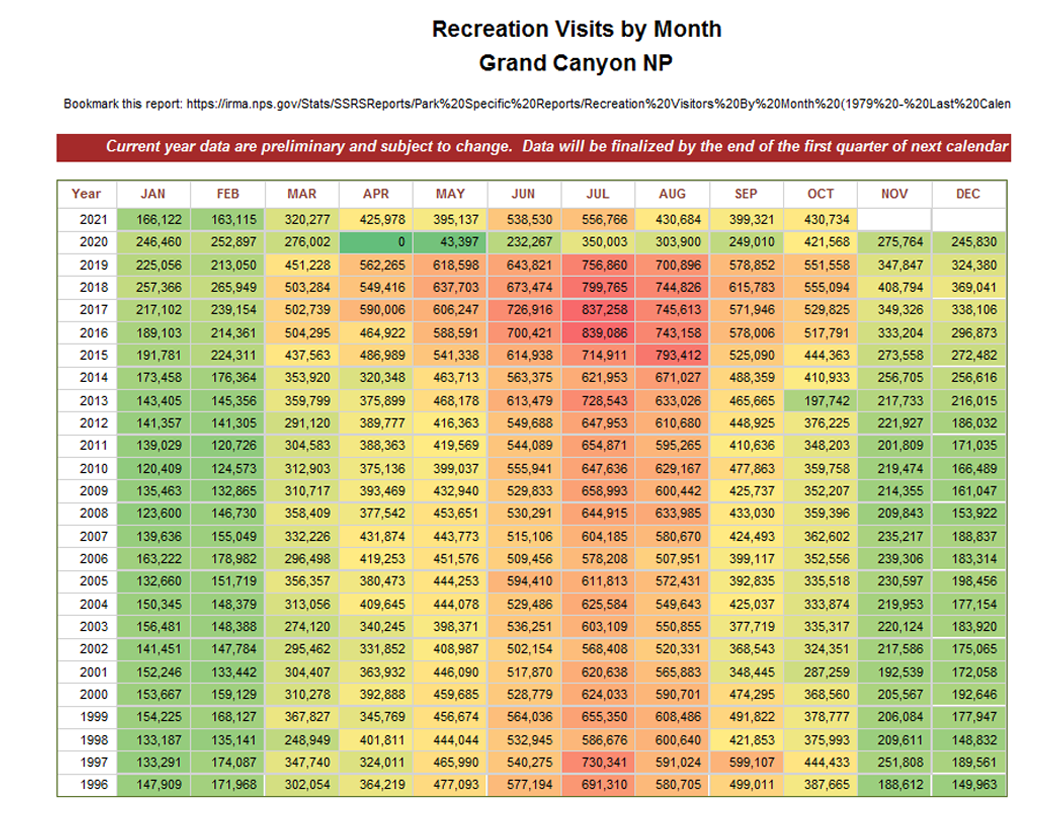
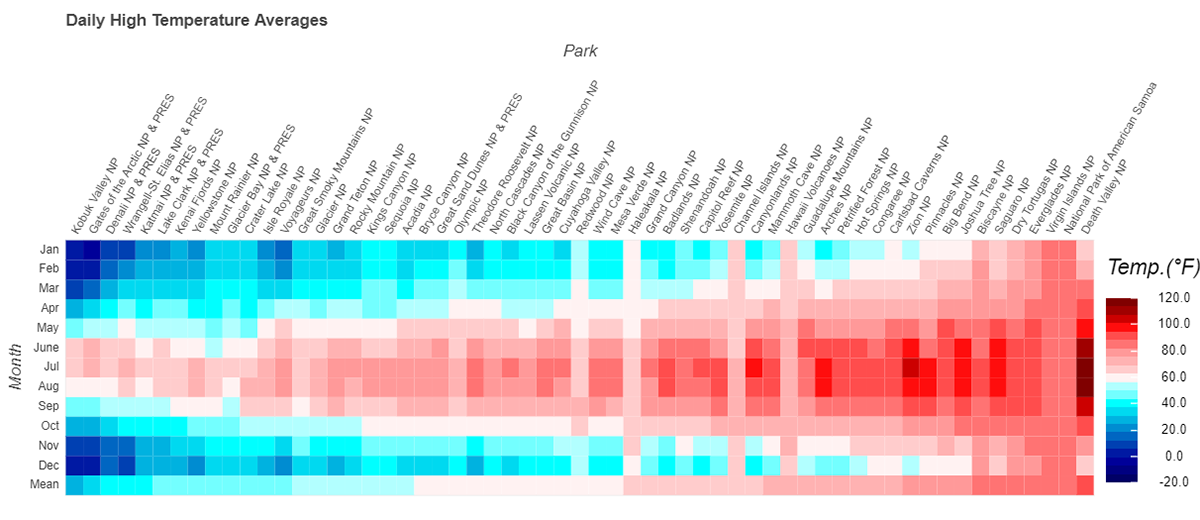
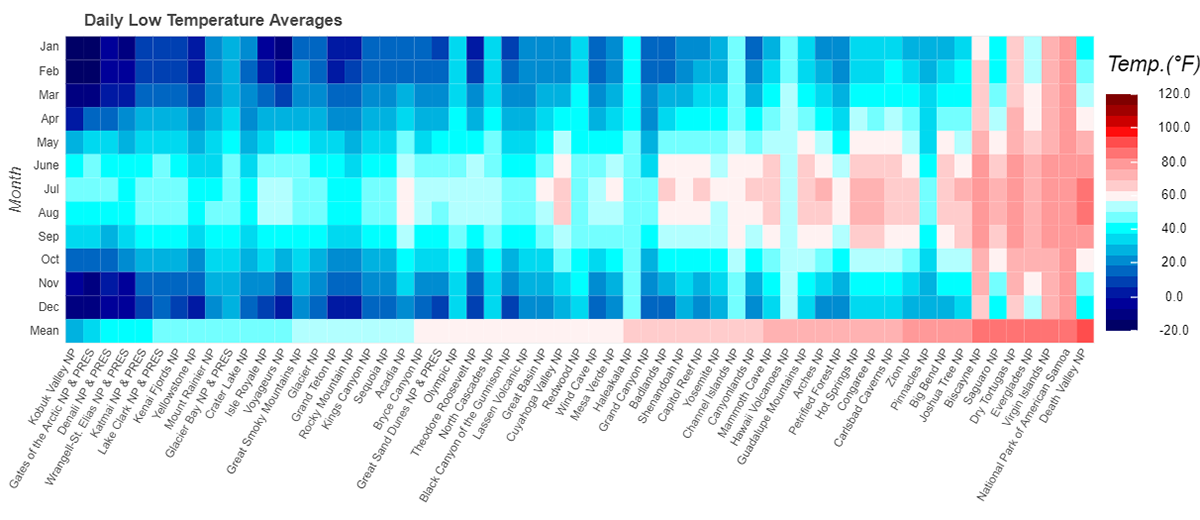
Let us first look at the charts below. They clearly show how different times of the year attract thousands more recreational visitors to these two parks. Keep in mind that all 423 national lands have their own custom chart like these. I created these two charts to simply give prime examples of what the lands see on a monthly basis. Through my research, I have found that there are 4 major factors that determine these shifts. Below, we will be dissecting these four factors by utilizing data research, personal experience, and interviewing NPS employees.
Location (Geography)
Location of National Lands can decide how many and what kind of recreational visitors they host and determine what time of year they flock to the park. Some national lands experience harsher weather conditions than others because of their geographical location. A couple of extreme instances that I've had the pleasure of interacting with are Yellowstone National Park and Death Valley National Park.
I have had many first-hand accounts of Yellowstone weather conditions through my travels, along with a great insight into Death Valley National Park's weather conditions through my interview with 16-year management assistant Abigail Wines. Yellowstone experiences massive amounts of snowfall 5-6 months of the year. This weather prevents the park from attracting recreational tourism for safety concerns, resulting in a massive influx of visitors during the summer months. Fellow national park researcher Tristen Schuler found that Yellowstone's average daily high temperature lasts for only two months in July and August at a bombing 72 degrees. My findings reported that these two months of warmer weather bring just under 2 million recreational visitors (in 2017) to the park. Whereas, winter months that deliver a daily average temperature of around 1-3 degrees and more than 12 feet of snow annually allow roughly 10,000 recreational visitors to partake in winter excursions within the park.
Only 812 miles away is Death Valley. In contrast, Death Valley is the hottest place on Earth, averaging a daily temperature of 114-116 degrees in the summer months. Management worker Abigail Wines said that their sheer size and strategic location aid them in being a tourist powerhouse. Death Valley's visitor number surprisingly remains substantially high through these scorching temperatures. This is because of the park's strategic location.
Some national lands are considered "destination locations" for most recreational visitors. Yellowstone, for example, is considered a destination location during peak ideal weather months as people travel there to experience its wildlife and natural wonders like Hayden Valley, Grand Prismatic Springs, and Old Faithful. Death Valley, however, is seen as a destination location during the winter months whenever the temperatures are more bearable. Though Wines pointed out that Death Valley's visitor demographics are 60-70% international.
During the summer months when travel is at its highest, Americans and international tourists travel the world to see wonders like the Las Vegas Strip, the Grand Canyon, Yosemite National Park, and the great cities and forests in California. Directly centered in between this bunch, Death Valley National Park, the largest National Park in the lower 48 states. The location of certain national lands can easily create a certain category of visitors that stop by "pass-through locations" while they're on their way to their "destination location."
The chart below gives an ideal impression of when National Parks can expect to see a peak in recreational visitation based on daily temperature highs and lows.

Activity
Attractions include any major experiences a visitor can encounter within a national land. This may include a natural attraction or an attraction created and/or provided by the NPS. As I mentioned before, Yellowstone beholds its untouched wildlife, Old faithful geyser, and Grand Prismatic Spring, a spring heated by the Earth's core. Other attractions around the nation include:
- Mount McKinley, the tallest mountain in North America, is located in Denali National Park.
- Grand Canyon National Park is the world's largest canyon.
- The Lost Monarch Redwood Tree measuring 26 ft diameter and 320 feet tall located in Red Wood National Park.
- Fan boat tours in Everglades National Park, home to thousands of indigenous alligators.
- Dry Tortugas National Park, the only park that spans 100 miles yet only has a land surface area of 0.2 square miles. Also, the only National Park that has to be reached by plane or boat.
- Off-roading in a 4x4 through the uneven terrain in Zion National Park.
- Snowmobile tours in Grand Teton and Yellowstone throughout its winter months.
All of these features that accompany the national lands are potential incentives for guests to come to visit. Each park has its own "attractions" and attractions can mean different things to different guests. For example, supervisory visitor use assistant Jess Rowley at Antietam National Battlefield observes the constant flow of tour groups, school groups, and military rides visiting the battlefield. Their "attraction" is the history of the nation concerning an infamous battle of US history, while other national lands (most commonly National Parks) are equipped with a much more viewer-friendly and personal experience setting.
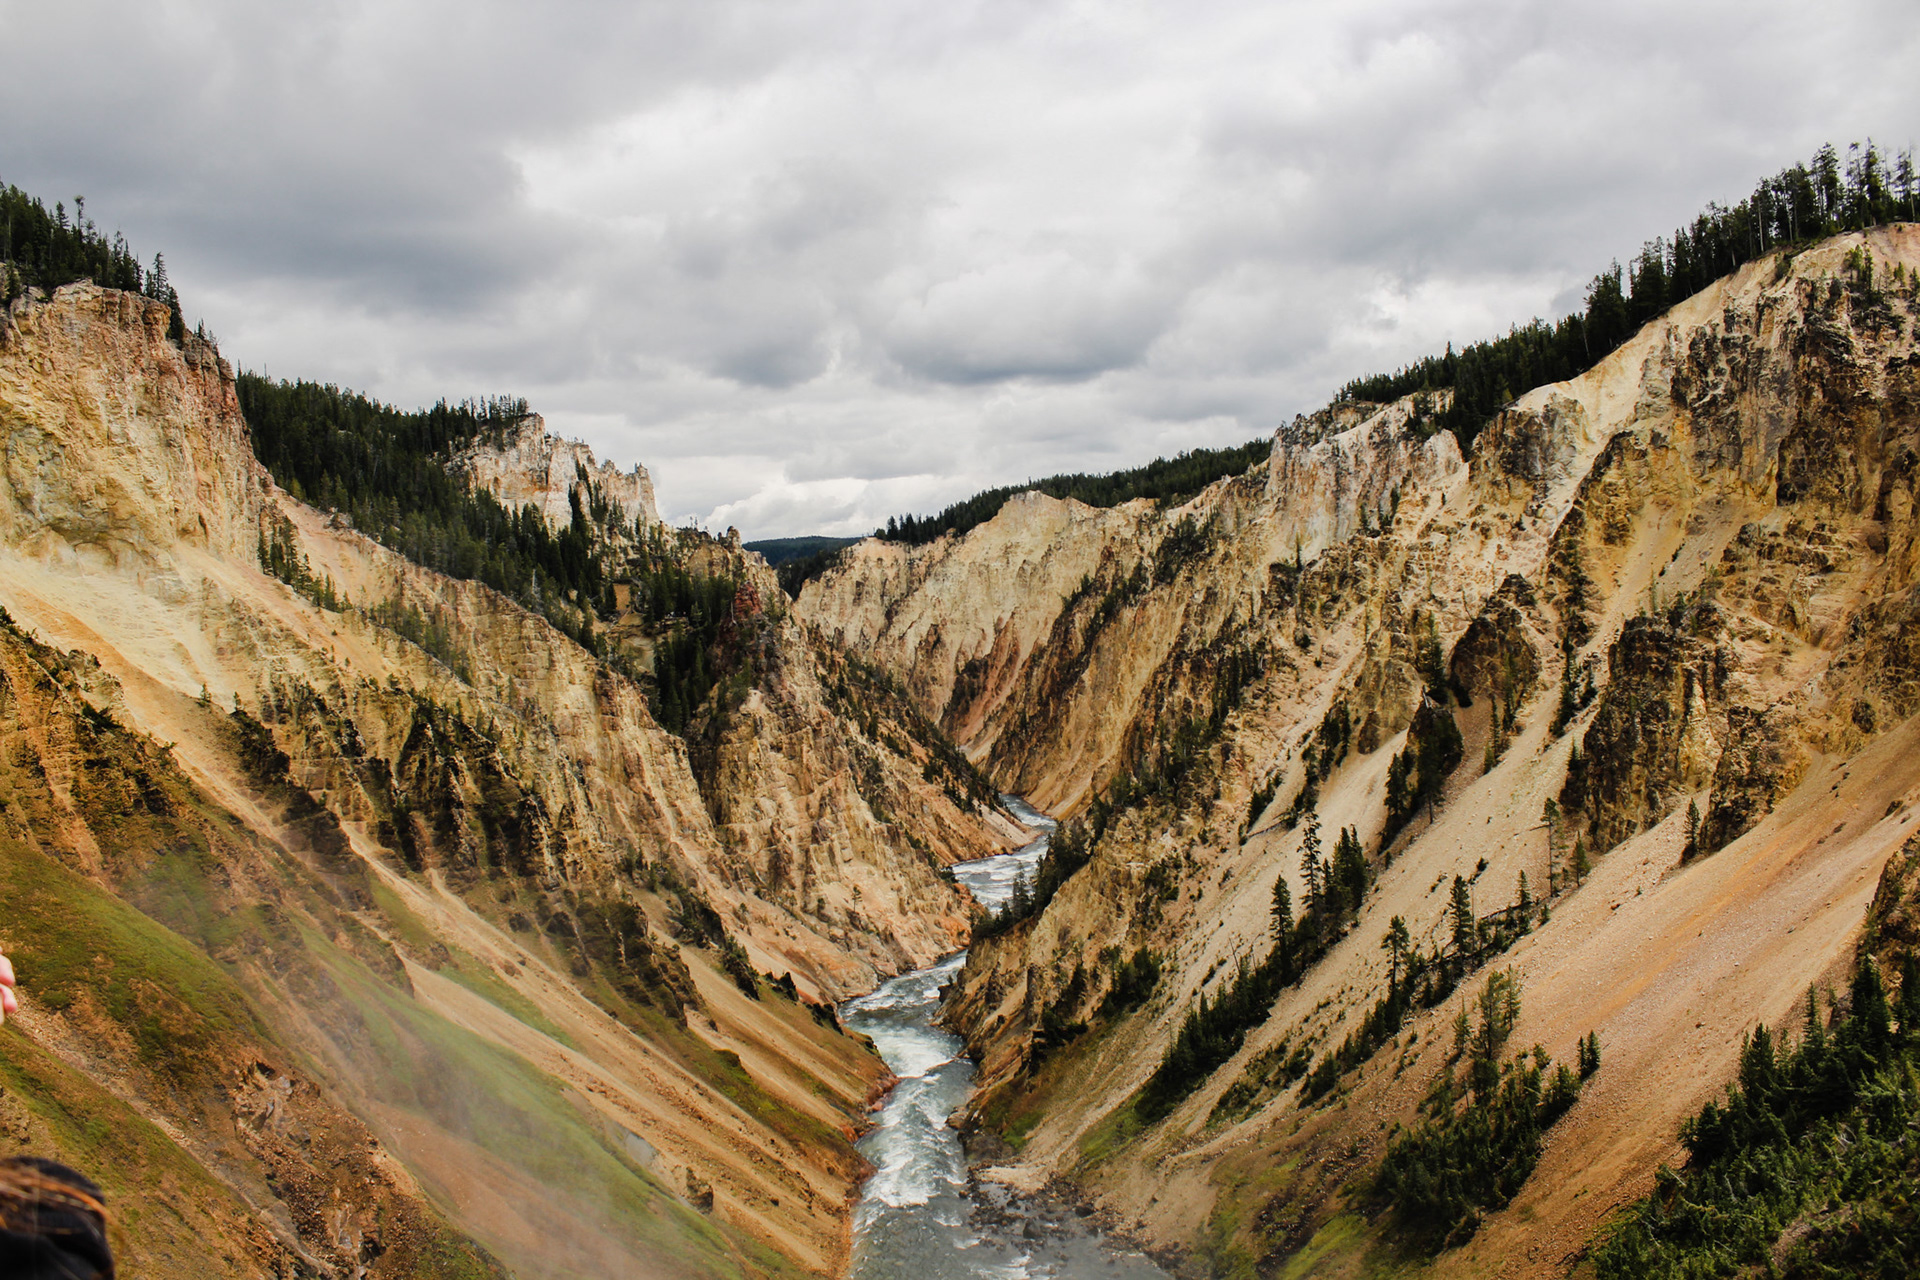
The Grand Canyon of Yellowstone
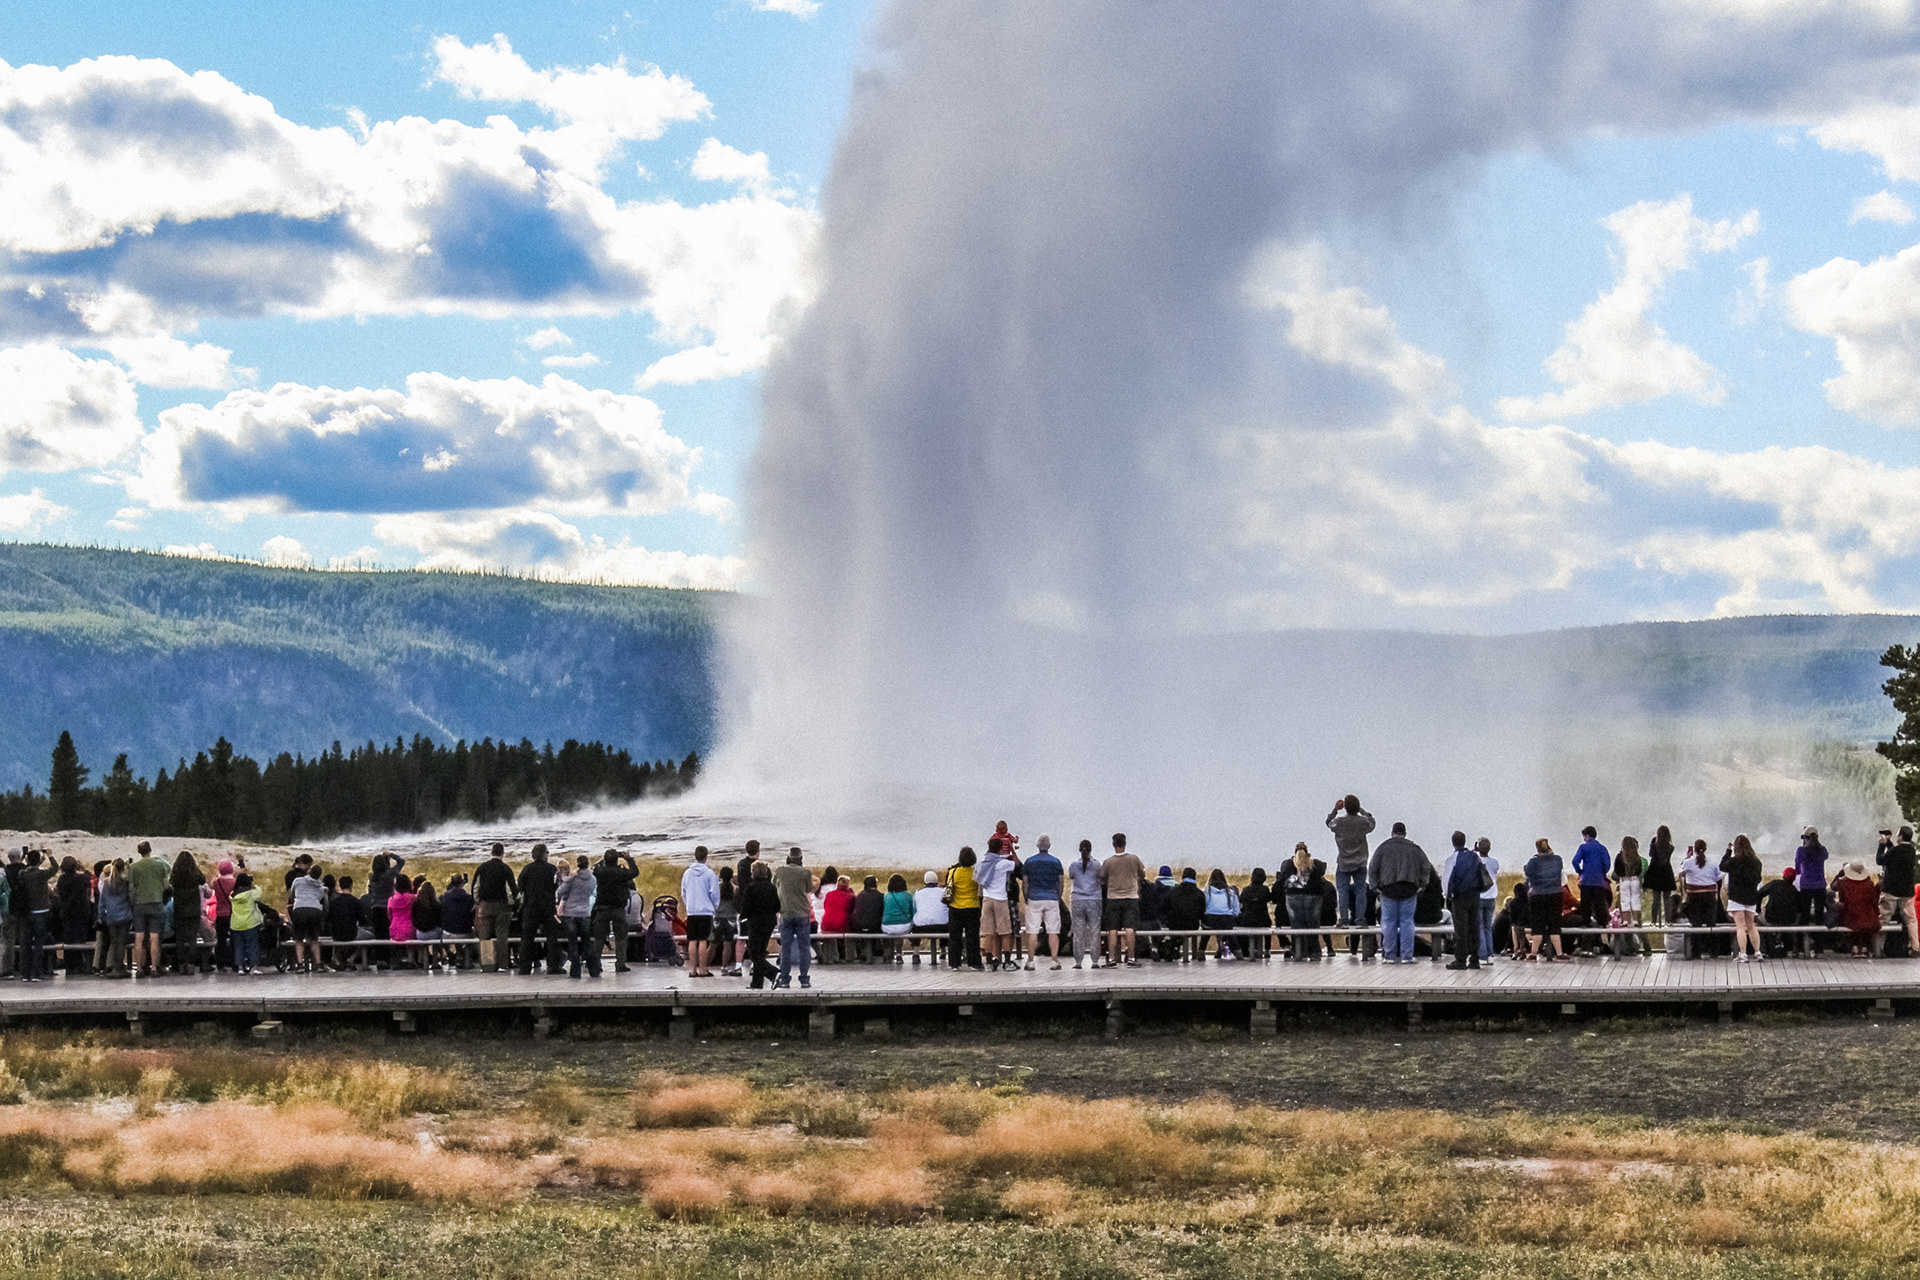
Old Faithful Geyser
Social Media
Social media has arguably been the sole reason for the highest number of recreational visitors parks have seen within the last 20 years. Whenever national park photo-op locations are buzzing on social media, data shows that those national lands receive an influx in recreational visitors. Hikes like Devil's Landing in Zion National Park have gone from occasional hikers to lengthy waiting lines and reservation times within the last 5 years due to social media spikes.
In the chart on the right, it can be seen that Zion National Park's visitation numbers have more than doubled since 2001 (with the exception of the pandemic fall-off). Many national lands have seen a skyrocket in visitation during this timeframe as social media has been on a constant progression. The frequent peak that is seen throughout the NPS in 2016 can thank the #findyourpark initiative. 2016 was the National Park Service's centennial anniversary, therefore sending millions of people to the cyberworld sharing their experiences, photos, and blogs about the national parks with everyone else. The initiative clearly worked having numerous national lands host a record number of visitation.
The amount of control social media has on the lands is something to note as well. The age of the parks is an important consideration because some have had a different amount of time of exposure within the social media world. New River Gorge National Park is the United State’s newest national park. It became a national park on December 27, 2020. New River Gorge’s Instagram page has reached 30.7 thousand followers in the almost 12 months it’s been a national park. Grand Teton National Park has 671 thousand followers and hosted over 3.2 million visitors in 2020. Clearly, the number of followers can somewhat hint at a correlation to the park's visitation, yet the power of social media has the ability to quickly change that based on what is trending.
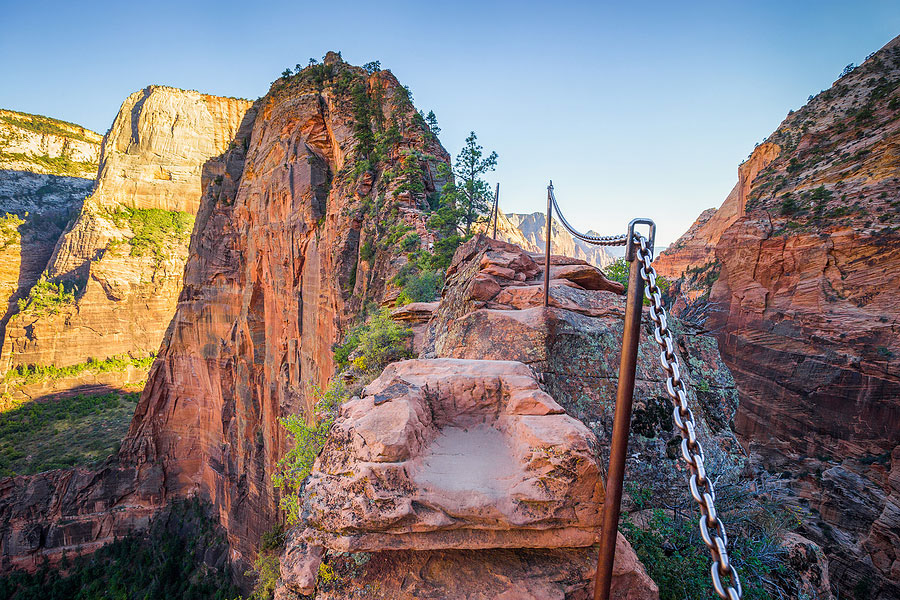
Angel's Landing (Zion National Park) hike pre-social media exposure

Angel's Landing Hike (Zion National Park) in recent years
Quality of Infrastructure
Infrastructure can easily attract or deter potential visitors. According to the NPS, every year, staff at every national land "review and validate their inventory of roads, buildings, trails, and other infrastructure; conduct inspections to identify deficiencies, and document the condition of these 'assets' as measured against the industry maintenance or condition standards." This is referred to as condition assessment and this process is vital to either maintain or improve the quality of visitor experience which directly affects visitation numbers. Quality of infrastructure within the NPS may refer to parking, lodging, trails, roads, pull-offs, signage, buildings, utility systems, and more. Essentially anything that a visitor can interact with or have a direct impact on.
For this project, I have pulled the most recent available data on Mount Rushmore National Park and its infrastructure plan. The graph on the right visualizes Mount Rushmore National Memorial's estimated and preferred spending based on their examination of their infrastructure quality. The national lands and their visitors share an interesting give-and-take relationship. Almost all of the money spent maintaining and/or repairing infrastructure comes from visitor spending. So, if a park has high visitor spending, it in turn will have high infrastructure spending, and vice versa.
In 2020, 2.1 million park visitors spent an estimated $124 million in local gateway regions while visiting Mount Rushmore National Memorial. These expenditures supported a total of 1,830 jobs, $52.4 million in labor income, $88.0 million in value-added, and $162 million in economic output in local gateway economies surrounding Mount Rushmore National Memorial. Along with these expenditures was nearly $20 million on infrastructure maintenance. Visualization of 2020's visitor spending in Mount Rushmore National Memorial can be seen in the graph below (right).
The graph below (left) is a bird's-eye view of the NPS's financial footwork. When compared to the overall NPS recreational visitation we can clearly see that high visitation years brought in more revenue which allows for more expenditures on infrastructure.
All information used in this project can be found for public use on the NPS official website. Below are links to the information I used.
https://www.nationalparks.org/about-foundation/financial-reports
https://irma.nps.gov/STATS/
https://irma.nps.gov/STATS/Reports/National
https://irma.nps.gov/STATS/Reports/Park
https://irma.nps.gov/STATS/SSRSReports/National%20Reports/Annual%20Summary%20Report%20(1904%20-%20Last%20Calendar%20Year)